enrichment
社区首页 >专栏 > enrichment_all | 一键完成富集分析!~(配高颜值可视化!)
写在前面
最近做这些富集分析实在太烦了,我就自己写了2个函数,run_enrichment_all()和plot_enrichment_all()。
这2个函数可以轻松完成GO和KEGG的富集分析和可视化,具体大家看一下。
当然也参考了别人的代码,深表感谢哈!~
用到的包
library(clusterProfiler) library(AnnotationDbi) library(dplyr) library(ggplot2) library(tibble) library(tidyr) library(ggprism) library(gground)
输入文件
输入文件可以是SYMBOL也可以是ENTREZID。
我这里以ENTREZID为例。
data(geneList, package="DOSE") gene <- names(geneList)[abs(geneList) > 2] gene
开始富集
dir.create("./enrichment")
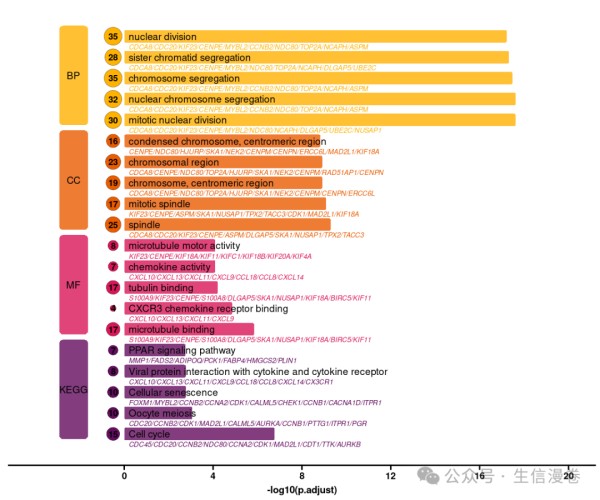
这里第一个函数,是基于clusterProfiler的,可以轻松完成所有的G0(包括BP,CC,MF)和KEGG分析。
如果你懒得改参数,这里我都有默认好的。
res <- run_enrichment_all(gene, species = "human", # "human", "mouse", "rat" id_type = "ENTREZID", # "ENTREZID", "SYMBOL" pvalueCutoff = 0.05, qvalueCutoff = 0.05, minGSSize = 5, maxGSSize = 500, readable = T ) write.csv(res$BP, "./enrichment/enrichment_all_result_BP.csv") write.csv(res$CC, "./enrichment/enrichment_all_result_CC.csv") write.csv(res$MF, "./enrichment/enrichment_all_result_.csv") write.csv(res$KEGG, "./enrichment/enrichment_all_result_KEGG.csv")
可视化
这里默认参数也是做好的。
当然你也可以按需更改。
显示top5条目plot_enrichment_all(res, top_n = 5)
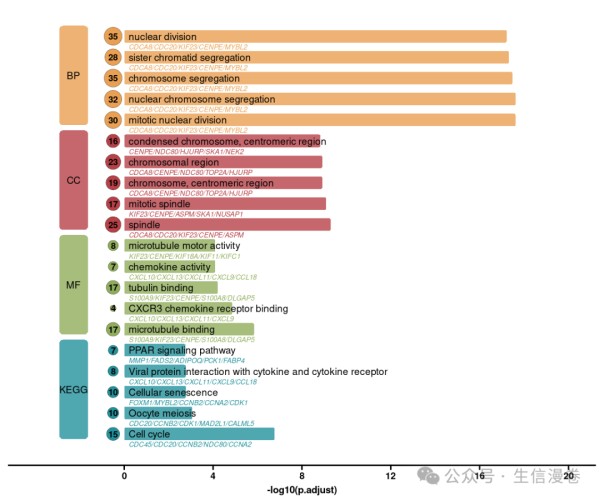
plot_enrichment_all(res, top_n = 5, gene_show_num = 10)
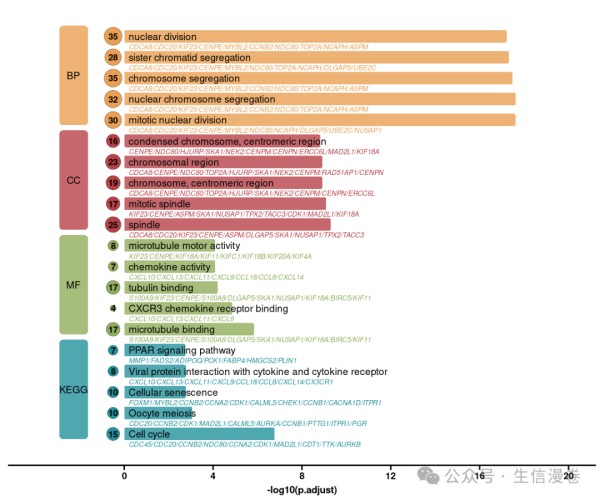
plot_enrichment_all(res, top_n = 5, # default 5 gene_show_num = 10, # default 5 color_palette = c("#640D5F", "#D91656", "#EB5B00", "#FFB200") )
本文参与 腾讯云自媒体同步曝光计划,分享自微信公众号。
原始发表:2025-04-27
,如有侵权请联系 [email protected] 删除
网址:enrichment https://mxgxt.com/news/view/1322084
相关内容
吕海泉清华大学深圳国际研究生院
杨颖
包燕平
李昱达
周小明
启明星人
悖论式领导如何促进员工工作—家庭平衡?
随便看看
最新实时动态
- 赵丽娜好高啊,星爷要跳起来合影
- 星爷的眼光好独到
- 于和伟万茜新剧团长敲打士兵钢盔引热议
- 大S晒汪小菲2600万借剧怒怼:嫁豪门稳赔 大s晒汪小菲借条 微博VC计划
- 恭喜卡萨金娜与扎比亚科在雅典完婚
- 寒雁与傅云夕 含泪告别 微博VC计划
- 一看到王俊凯站在舞台上就完全挪不开眼睛-今天的俊凯也很会表达爱呢
- 丁禹兮在叽里咕噜说些啥,想结婚
- 杰西卡阿尔芭奥地利偶遇帕梅拉,自曝与女儿跟练难
- 寒雁向jeff哥说真心话 微博VC计划
热点实时动态
- 133554
- 25469
- 20067
- 19755
- 19503
- 19461
- 19193
- 18764
- 18743
- 18716